Wings & Nodes Diagnosis
To open the Wings & Nodes Diagnosis Window, press Tools and tap Wings & Nodes Diagnosis.
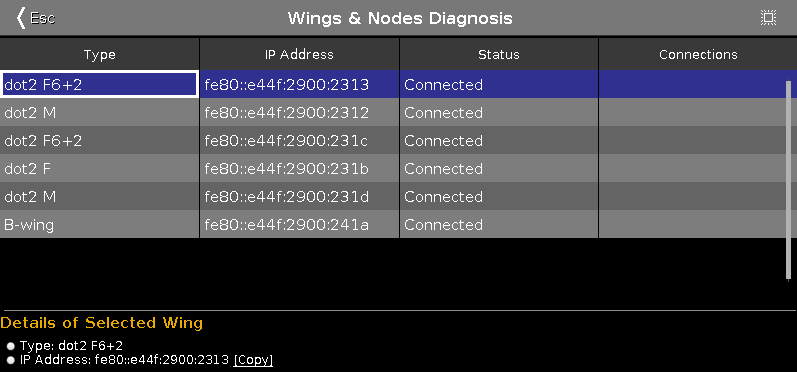 Figure 1: Wings & Nodes Diagnosis Window
The Wings & Nodes Diagnosis Window is useful if technical support is needed.
The Wings & Nodes Diagnosis displays the connection status of the console, wing, or Node4.
To select a type, tap in the table. The row of a selected type has a blue background.
The table has four columns:
Type:
Displays the type.
IP Address:
Displays the IPv6 address.
Status:
Displays the connections status e.g. connected, not connected or downloading firmware.
Connections:
Displays the amount of connections.
You can also identify every device in the network.
Select the device in the table, and tap at the frame icon  in the title bar.
An orange frame starts to flash on the screen of the selected device.
To leave the Wing Setup Window, tap  in the title bar or press Esc on the console.
Details Area
Section titled “Details Area”The details area displays details regarding the selected type.
Encoder Bar Functions
Section titled “Encoder Bar Functions” Figure 2: Wings & Nodes Diagnosis Encoder Bar
Scroll:
To scroll in the table up or down, turn the encoder left or right.